Spu’s & SDS….yesterday’s close is a perfect example of why I prefer to trade Futures Vs. ETF’s. The S&P 500 Futures closed above our break down level. With the Futures, since they trade 23.50 hours a day, you can wait for the close and then trade the new direction or time frame.
ETF traders don’t have the luxury of a 24 hour world.
We chose unwisely.
SDS…Sell the SDS when the market opens.
Oil…needs to sustain over 95.75 for higher. 97.25 is qtrly resistance.
98.15-25 is where the macro buy stops are.
30 yr. Bonds…145.00 will be pivotal all day.
Euro…Point & Figure charts show new price action under 128.40 is needed for lower, cover shorts into 127.70 the first time down. Leave the protective Buy stop in place @ 129.70.
AUD/USD… we’ll be looking for 96.00 with any type of price action below 97.25.
DXEM…June Dollar Index…8362-66 is support.
8424 is last years high and will be the near term resistance. By sustaining over last years high we expect to see a test of 9000 over the medium term.
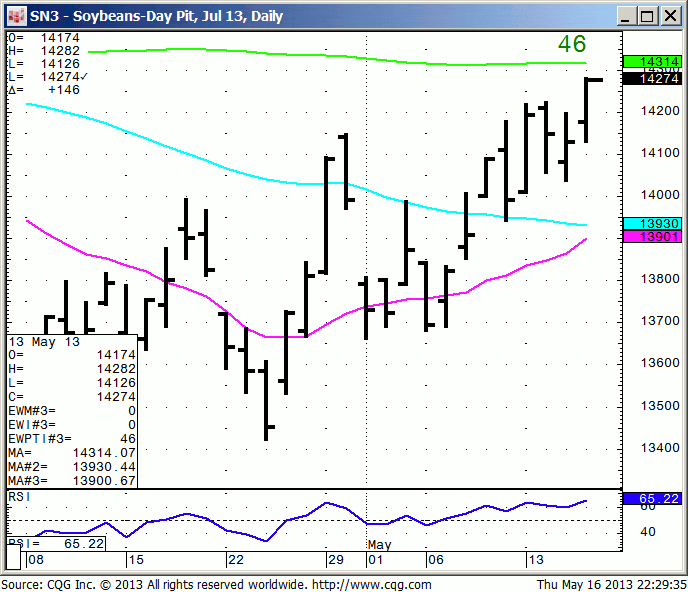
Soybeans (N)…sustaining over 1440 can lead to a 60 cent rally. The technical look is very different
when looking at a “Pit only” July contract and an all session continuation chart.
The charts visually show the source of my angst and reticence to buy the grains straight away on the 14th when I was originally looking for a low.
JJG…49.85 still seems a reasonable stop out to manage long grain exposure, just below last weeks close.
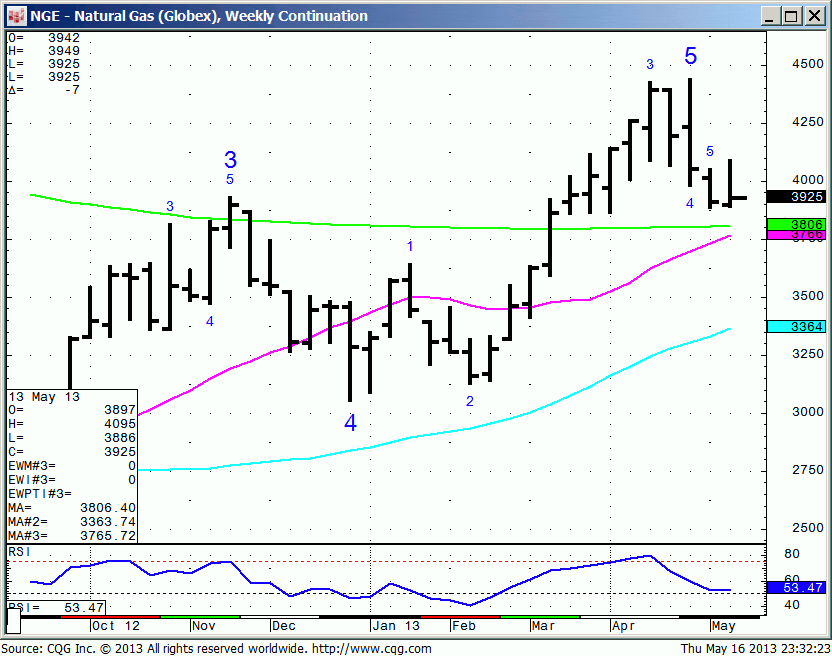
Natgas…the weekly stops are under 3.88. This is also a weekly ORL #. So it has broader implications late day if it puts in this type of negative pattern.
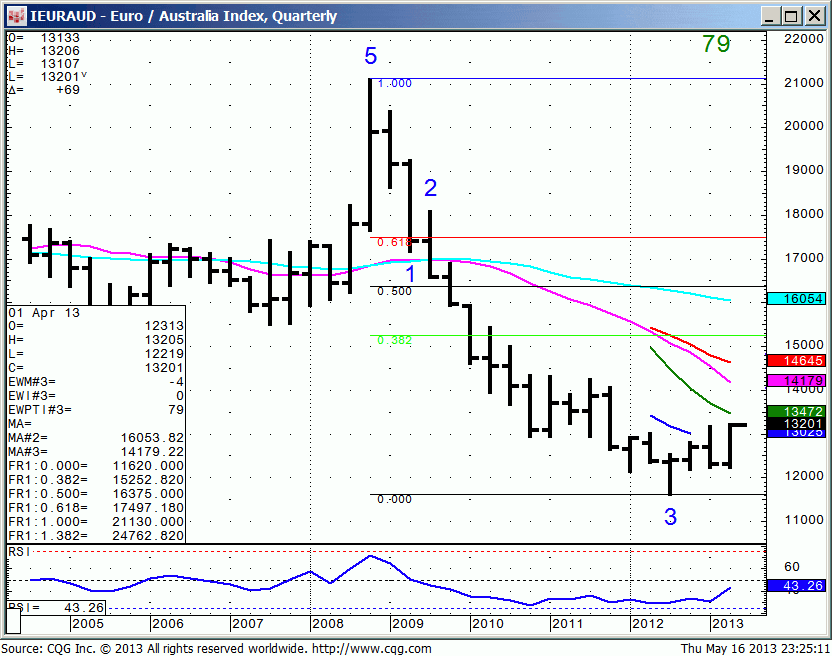
EUR/AUD…ran the qtrly buy stops @ 131.92 in Asia. 130.80 should be used as a trailing stop.
General Comments or Valuable Insight
Some of my Fund managers have told me they have big positions what they need to roll today in the Equity options. Hence, I want no part of the Equity Indices.
The Dollar has been much easier to identify support and resistance to day trade and the trend is just up.
We did OK in the VIX trade even though we left a lot on the table.
It’s a new paradigm when the VIX goes up because Managers are under weight equities and petrified of a melt up not a melt down.
This was created by massive call buying over the past couple of days. Using this rational I should’ve stayed with the VIX because it’s apparently a no lose scenario. Go figure…
I think I’ll just stick to my charts!
Note…we always write a stop with any instrument we‘re interested in. As the instruments become profitable those stops should be raised to your entry level so you don’t lose money.
Short Term View…
Use the Chicago openings to help guide your trading.
Use the 4/30/13 closes for your short term pivots in everything!