Stocks..
Nasd 100…shows a head & shoulders top formation on both the daily and weekly chart. 3250’s is the first place to look for a bounce.
Recovery and a close over 3358 would have me thinking this was a one day event.
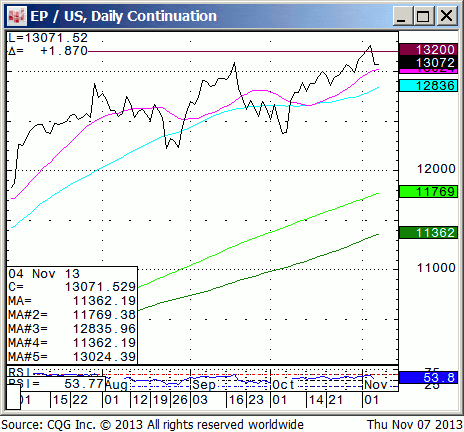
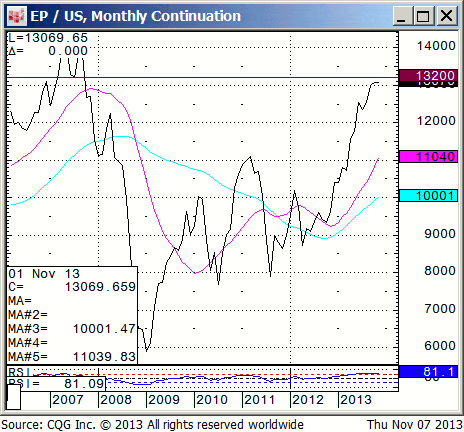
Spu’s…need to close over 1747 to keep the weekly pattern positive.
I need to see a close today over 1761 resistance to negate the daily pattern.1730-34 is the first support zone. Below look for the Spu’s to move in 20 point increments to the downside.
BLK...has been the poster child for the Bull mkt in Equities. BLK needs a close over 304 to negate this Risk Off Pattern.
PCLN…1015 is support. Priceline is attempting an ORL week with a close below 1044.
VIX…14.40 is mvg avg resistance. 15 +- a few seems to be the big overrun extreme the first time up to match up with a low in the Equities Indices.
Bonds
30 yr….134.08 is resistance and the up side pivot. I would not fade price action above.
FX…
EUR/AUD…needs over 142.50 to rally anywhere.
AUD/JPY…92.50 is a good enough low to hold, however this is just one more instrument I’d rather let the dust settle on and take a fresh look
after 9 CDT.
Commodities…
Gold…needs price recovery and a close over 1330 for it to rally anywhere.
Silver…20.90 is the hold level on the longer term point & figure.
General Comments orValuable Insight
There are plenty of Risk off patterns to look at.
The expectation is for a poor # given the govt. shutdown.
I have no skin in this game. We could easily head lower into Thanksgiving
before finding a trad able low in the Equity Indices or bottom today.
My bias is to let the Bots have their way with the market and miss
the early price action.
I’m lacking true religion “No conviction”
SPU/BONDS show 2 very different scenarios depending on your time frame.
When I see charts that show very different possibilities I prefer to let everyone else lose a lot of money until the dust settles and the picture is clear to me.
Short Term View…
Keep trading to make money. The opportunity will be in individual names.
Individual stocks look to be an easier read based off their own technical s. The Equity Indices seem stretched at these levels.
Go with the flow. Use the 9/30/13 ( September 30th) closes as your macro pivots. Trade the opening ranges and early time frames.
Today’s Working Orders..
No Working orders
Current Positions…
|
|
Opened |
Price |
Stop TGT |
|
|
|
|||||||
| No Open positions | |||||||||||||