Stocks...
Spu’s…2060 is the 200 DMA. Looks like we’re in for another test of this level.
Nasd 100..4509 is fib support with 4500 being today’s 50 DMA. This is a cover zone the first time down. You’d expect a bounce from this level.
Bonds …
30 Yr…157.04-14 is the low risk sell zone.
FX…
AUD/USD...71.61 is the Fib retracement for the past 15 years. It’s a significant level given the oversold nature of the shorter time frame charts.
EURO…111.15 is resistance.
Swiss Franc…105.17 is mvg avg resistance.
Commodities…
Gold…1114 is the low risk sell zone.
Gold…1114 is the low risk sell zone.
Brent…50.50 is where the up move started in late January. We could eventually go back there. The next set of macro sell stops are @ 52.50.
Oil…Friday I was looking for 47.48 to print. It took a little longer than I anticipated. Sell rallies not breaks.
General Comments or Valuable Insight
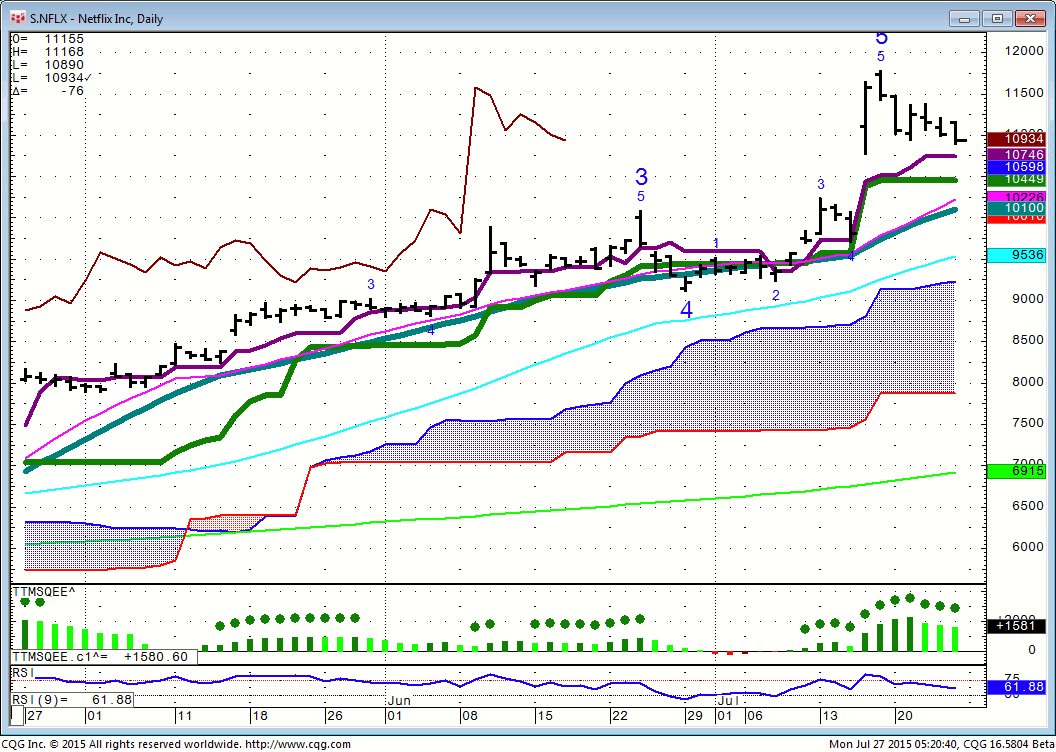
The U.S. equity indices have been trading with the big four AMZN, GOOGL,NFLX & FB.
The first three are in retrace mode. It gets down to how they back and fill into their respective earnings gaps. As these names went into profit taking mode after their earnings, so went the Indices.
All that remains is FB Wednesday. 94.33 is today’s mvg avg support.
I’m a buyer of weekly calls if FB gets into the 91 handle before earnings.