Euro Stoxx…2700-2719 is short term resistance and the upside pivot.
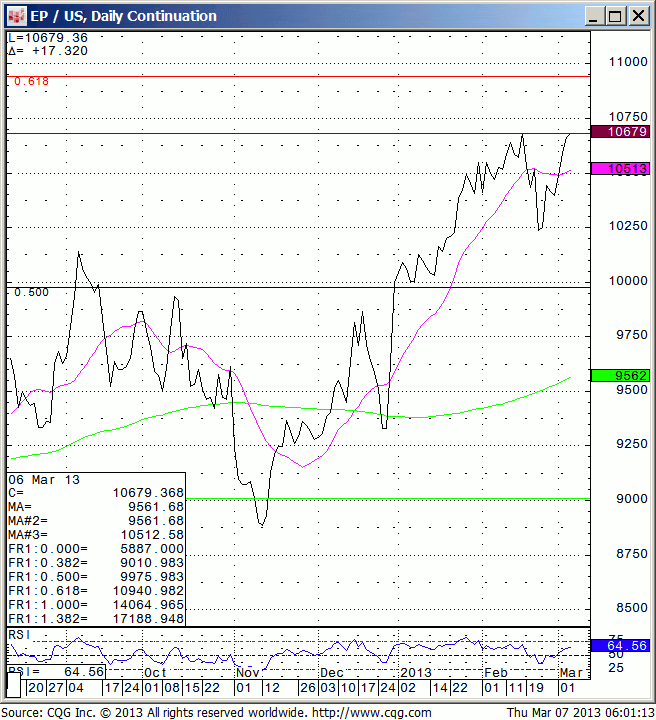
Spu/Bonds…the daily shows possible price rejection right here, however any sustained
action above this level leads to the red line on the chart, which means the equity indices have a lot more to go
on the upside.
EUR/USD…130.68-75 is first resistance. All new strength over this level is needed for higher.
Canada futures…96.96-97.00 is the monthly pivot. Price action above 97.26 is needed for higher.
98.00 + a few is macro resistance.
Oil..the general levels are 91.25 on top and 89.75 below. The pattern shows the need for violation of either
for a new move.
Gold…short term support is 1576. Buy stops are over 1587. Long term charts show new closing strength
over 1610 is needed to use 1557 as a low.
Silver…the general parameters are 28.40-50 for support and 29.35-50 for resistance.
General Comments…
Time Frame Trading…see how things open up and go with the flow.
Model Trading Portfolio……………..
Stop Close Profit Points
Everything I’ve written for the Month will appear.
Short Term View…We are using Monday’s closes ( 12/31/12) in everything for our trading bias for the qtr since all trading is bench marked against these closes.Use 2/28/13 closes as your short term pivots in everything.Medium Term View…updated qtrly
These are static levels that do not change.
The Medium Term View will no longer be available in our general archive section until the end of the qtr., however
new clients will receive a complimentary copy.