Stocks...
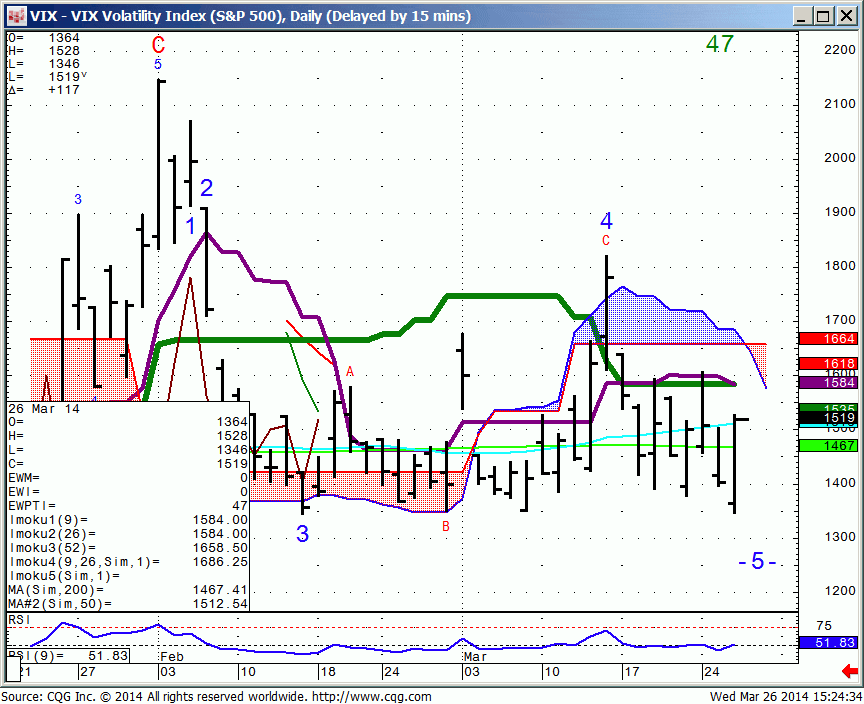
VIX…needs above 15.15 to rally to 15.84. The weekly buy stops are at 16.40 with 16.64 being weekly closing resistance.
Nasd 100…3545-50 is today’s support and the next inflection level.
The weekly breakdown level is 3576. Closing below here tgt’s 3500, and then the February lows @ 3412
The weekly breakdown level is 3576. Closing below here tgt’s 3500, and then the February lows @ 3412
Bonds
FBTPM…Italian 10 yr. is getting overbought. The wave counts show another 80 points is possible.
FX…
Euro…137.16 is today’s mvg avg support. This is not an area to press direction.
EUR/AUD…149.85 is the monthly ORL #. Pay attention to price action back over this area, for it could signal a short term low in the cross.
Any print near 147.90 should be deemed an exit zone the first time down. This is the 200 day mvg avg. and the cross would be oversold at this level.
In other words, it’s a good place to look for a bounce.
151.75 is macro resistance.
GBP/USD…needs a close over 166.70 for another rally.
USD/CAD…110.30-70 ( 90.16-33 Futures) is dollar support/ Canadian resistance. Sustaining and closing over that level can lead to a further rally.
Hedge Funds shorted Canada from app 104 in December.
Kiwi…has elected the buy stops over last years high of 86.78.
As long as this remains over 85.45, the longer term tgt is close to 90.00
Commodities…
Gold…breached the 1299 level. We’re looking to sell 20 dollar rallies.
Soybeans…(K) a close above 14.60 tgt’s 15.20. Multi year fib resistance is 14.64-78. Caution buying strength into this area.
It can be a directional fake out the first time up. Buy breaks/not rallies.
Brent Oil…107.80 ish is resistance.
General Comments orValuable Insight
We’ve been seeing opening range trades develop, with daily direction
confirmed within the first few minutes of NYSE opening..
We’re looking to sell failed rallies in the Equity indices.
Nasd 100…3623 is as good a spot as any with a tight stop.
Spu’s…1853 +- a couple
Opening Range Time Frame Trading again today.
Short Term View…
Keep trading to make money. The opportunity will be in individual names.
Individual stocks look to be an easier read based off their own technical s.
We are Neutral Equities.
We’ve included our medium term view from the beginning of the year so you can get a sense of what’s happened and where the markets are now.