Grains…
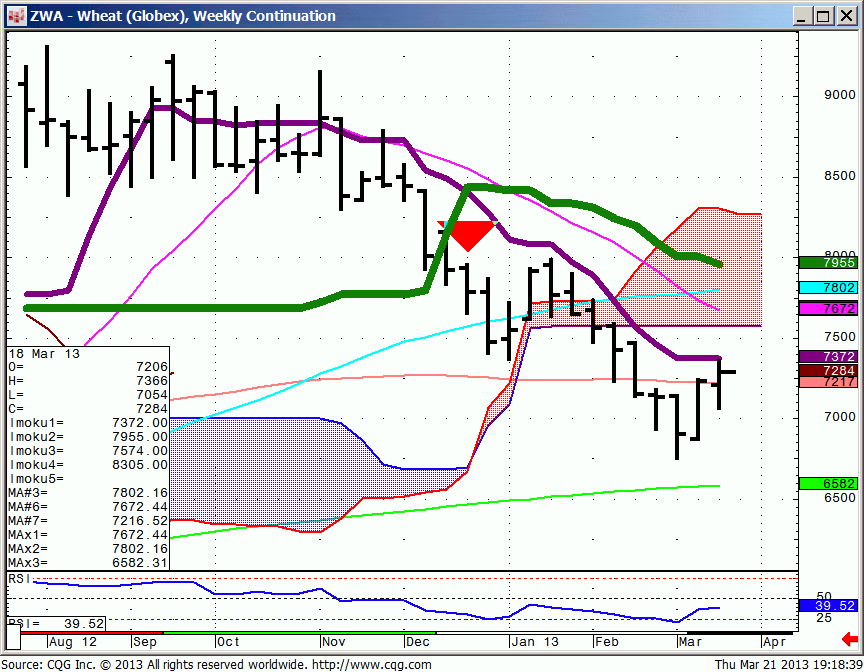
Wheat…needs all new closing strength over 7.374 for higher
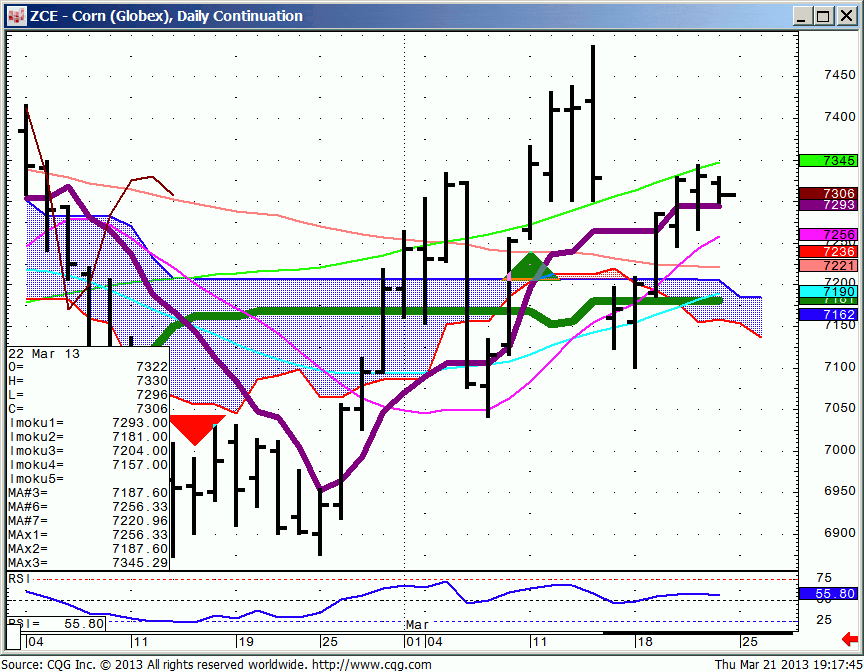
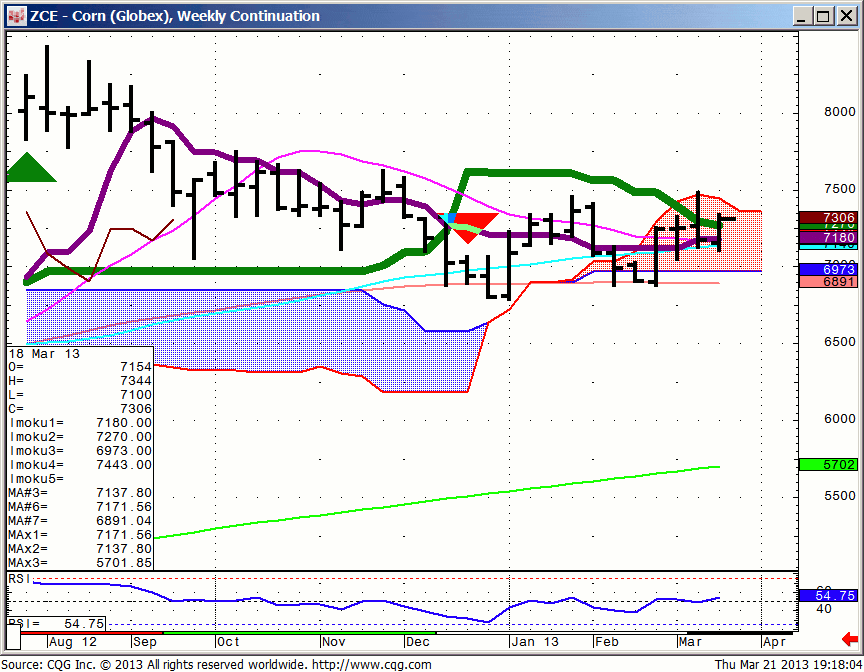
Corn…we like to see Corn hold 729 to avoid any lower retests. As seen by looking at the Green mvg avg line, ( 200 day) is temporarily capping the rally.
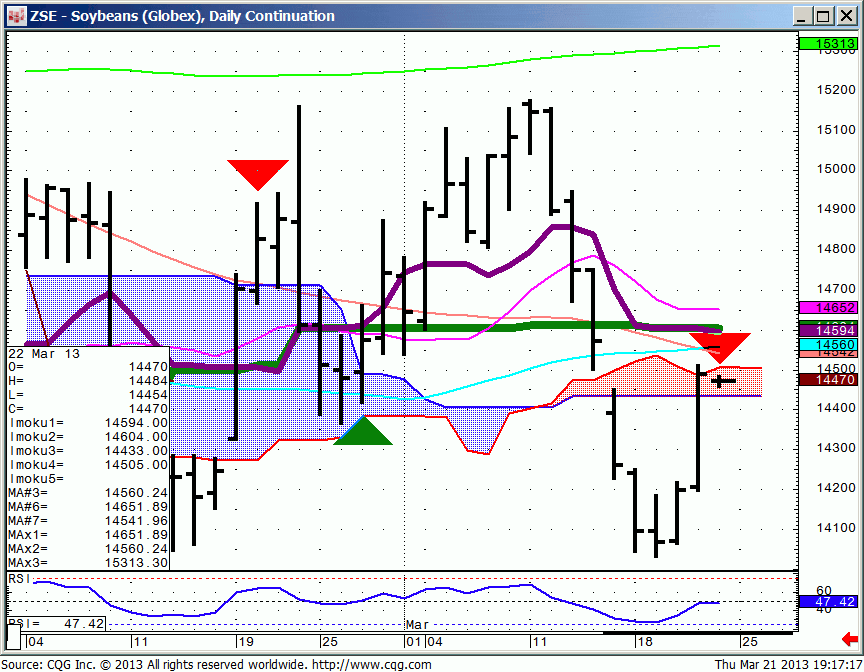
Soybeans…all new closing strength is needs over 14.60 for another leg up.
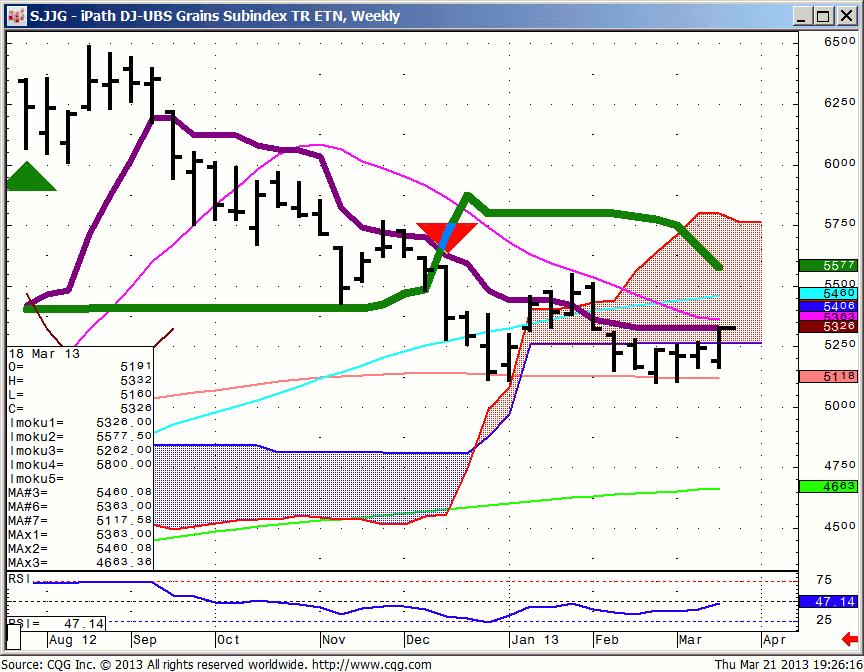
JJG…needs new closing strength over 53.65 for another run up. We’ll use a 51.50 stop on this, however we would not like to see any real price action under 52.
Ag names…have all gone Risk Off with the rest of the board. We’ll take a look at support levels for Monday.
AUD/USD…has completed it’s first expected swing. All new closing strength over 104.70 Cash (104.10 June Futures) is needed for another swing up.
EURO…not to sound like a broken record, but the 200 day ( app 128.75) keeps running the crosses!
USD/JPY…94.20 is first resistance followed by 93.80. (106.20 ish futures …106.74)
EUR/JPY…http://www.
30 Yr…I’m still looking for 144.15-17 as a rejection level the first time up. This is one of those levels, like 144.86 in the Bund, that can flip the board to “Risk On”. The rest of the world will be focused on 144.05-08. Set your alerts and pay attention to the board at these levels!!!
Bunds…a close over 145.10 will mean that Ivan has his chain saw out and is cutting up Cyprus! The first resistance that can reject is 145.52 (the high qtrly close of all time).
Sustained and closing price action over this level would lead to an increasingly risk off board. This could lead to a couple of hundred points on the upside in this instrument.
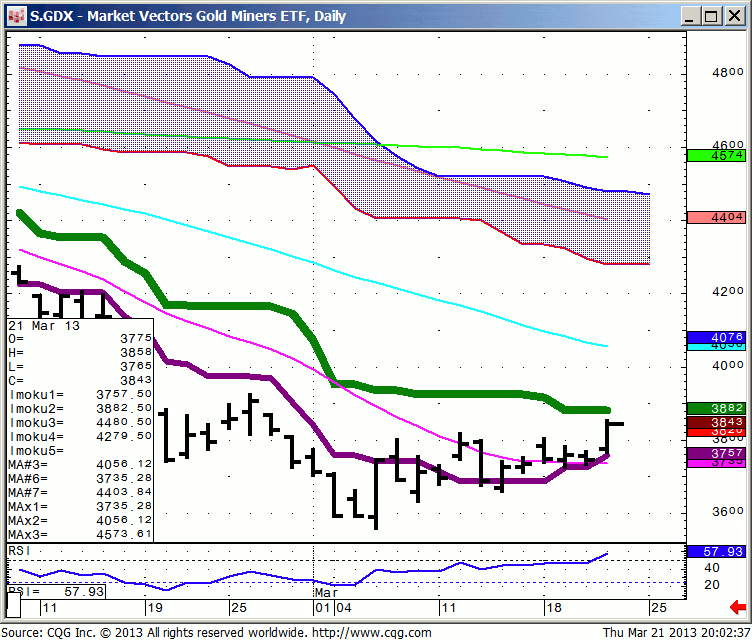
GDX…for those of you who bought this ETF, expect some price rejection @ 38.80. Raise your trailing stop to 37 close. We’re looking for this to move in 2 dollar increments once this closes over 38.80.
General Comments…
Let the Bond markets be your guide…whether Risk On or Risk Off…Look to your Bond technical s for the key. DAX/BUND..SPU/BOND it doesn’t matter.
For new followers…http://www.
for further explanation.
Family Time…
We will be traveling after 8:15 CDT today. The next update will be Monday.
FYI…Anytime you wish to look up levels, go to the website (Click on Pro Tips…add the instrument you are looking for in the box…) Everything I’ve written for the Month will appear.
Short Term View…
Trade your levels and forget the news. The news will be after the fact. Let the price action be your guide.
Medium Term View…updated qtrly
This was written the last week of Dec 2012
We’ll be compiling next qtr’s outlook for our paid clients over the next 2 weeks so stay tuned .
These are static levels that do not change.
30 Yr. Bonds …Last qtr. 150.15 ish was our short term upside pivot ( we like this level on a longer term time frame). Closing above this level would be short term positive the Bonds and negative the Equities. This qtr we’ll focus on 148.10 as our short term closing barometer. Closes below 145.20 will be needed for another leg down in the Bonds. Short term we have held and we will continue to favor the short side of the Bonds when market conditions allow.
The Spu/Bond spread has been running the show all year and we look for this correlation to hold over the near term.
When the markets trade Risk Off the Bonds will be the vehicle of choice to receive those outflows from the equities. Meaning, you have to be very patient with your sell levels in the Bonds. They can still get priced to very low yields with the help of investor sentiment and Fed meddling.
Spu’s... Last qtr we used 1462 close as our upside closing pivot for confirmation of an assault on the 1500 level. 2 closes above 1446 are minimally needed to launch the Spu’s higher this qtr.
Gold & Silver…the Dec. lows now become extremely important support levels and continued closes above the 1660 area in Gold are essential to prevent further profit taking. Silver sets up slightly different with 29.60 needing to hold and sustained closes above 30.70 for more upside.
Currencies…
AUD/USD… continues to be a good risk barometer. 102.25 ish is the near term macro pivot! ( This is a multi-year level) 111 is the upside pivot. Anything in between is just that, in between….no break outs! Closes above 105.70 would be deemed near term positive. In the big picture the Aussie has completed swing counts in both directions from the 111 high to the 95 level twice over the past 2 years.
USD/JPY…79.22 was our macro pivot. ( App 126.40 Futures) last qtr. This qtr we are using 83.30 USD/JPY ( app 119.85 H Futures) to run the Yen crosses against the Commodity Currencies.The Yen has come along way, although we have swing counts that could eventually see the futures trade another 400 points lower, we think this market is in need of an overdue correction and will wait for trading opportunities down the line.
EUR/USD….“119.75” +- 100 pips….is the macro pivot. Any price action the first time into this zone should be suspect ( possible Bear Trap), however closing a couple of days below this level is key to another big swing. This level has run several 20 cent swings in the Euro. It’s a significant area! These #’s are static and will not change. Furthermore, only closes under 131.50 will be short term price negative.
Natgas…We will continue to strategically look to buy hard breaks. The names will continue to be our preferred way to play the Natty. For the average investor the names provide more liquidity and a user friendly venue for capturing Alpha. 3.00 now becomes the key hold and pivot area for the next qtr.
Grains…Our long term strategy is to buy 8-10% breaks in the ETN & ETF’s.
Oil…continues to be a good demand indicator, with failed rallies telegraphing little follow through in the Equity Indices. $78 which is the 50% Fib for the life of the Futures will continue be a key level on the downside and $100 on the up. When the market is Risk On the names here will provide a better trading venue for the average investor. We remain friendly to the Oil as long as it maintains above 87.50.