

Stocks...
Nasd 100...4384 is support and the downside pivot.
Bonds …
No desire to be short
FX…
EURO…113.20 is support. Equities down has been positive Euro.
Commodities…
OIL..47.20 is resistance.
General Comments or Valuable Insight
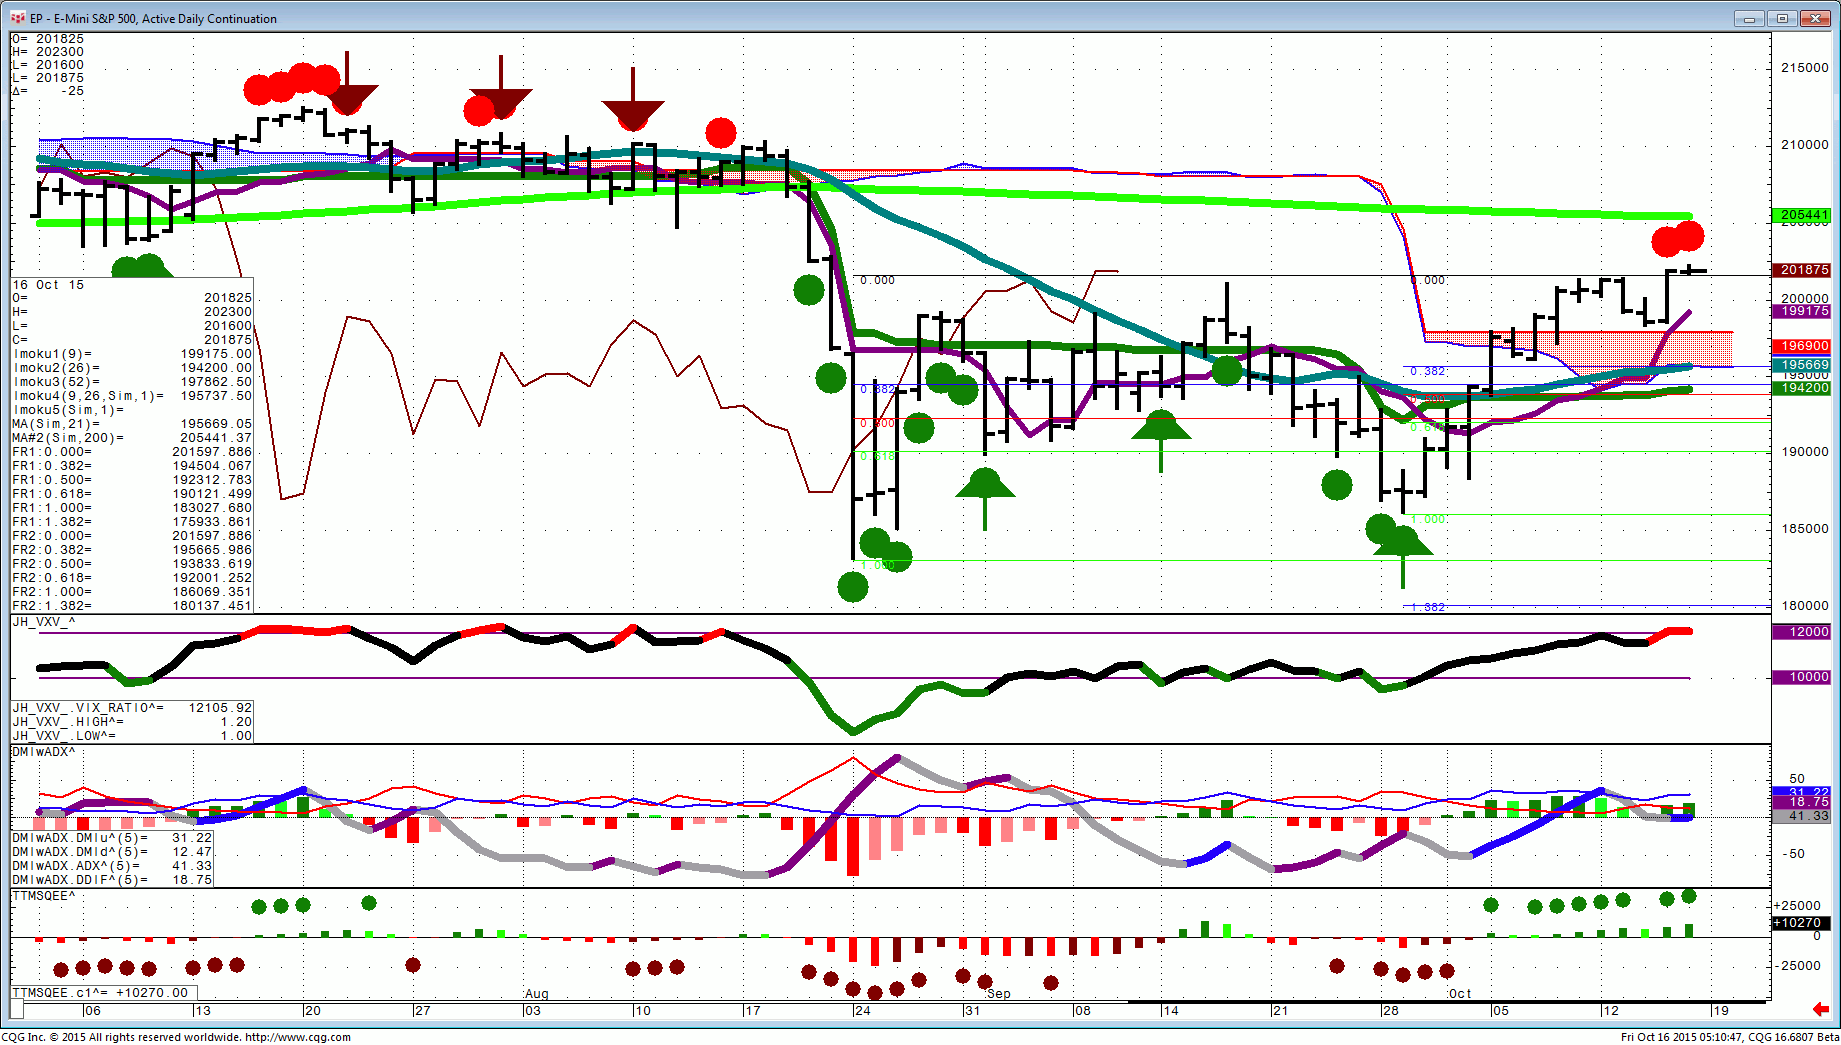
Attached is my volatility chart which shows red dots on the daily for the first time since mid August. This is a caution signal for Longs
I’ll be selling my 107.50 QQQ calls on the opening.
I just sold a few Nasd Mini’s @ 4420 to hedge my calls.
My game plan will be to try to stick with the rest until the close
I will be going home with no position.
Investors with Longs in individual instruments should review their stops.
At the very least you should risk no more than yesterday’s lows in anything!!!
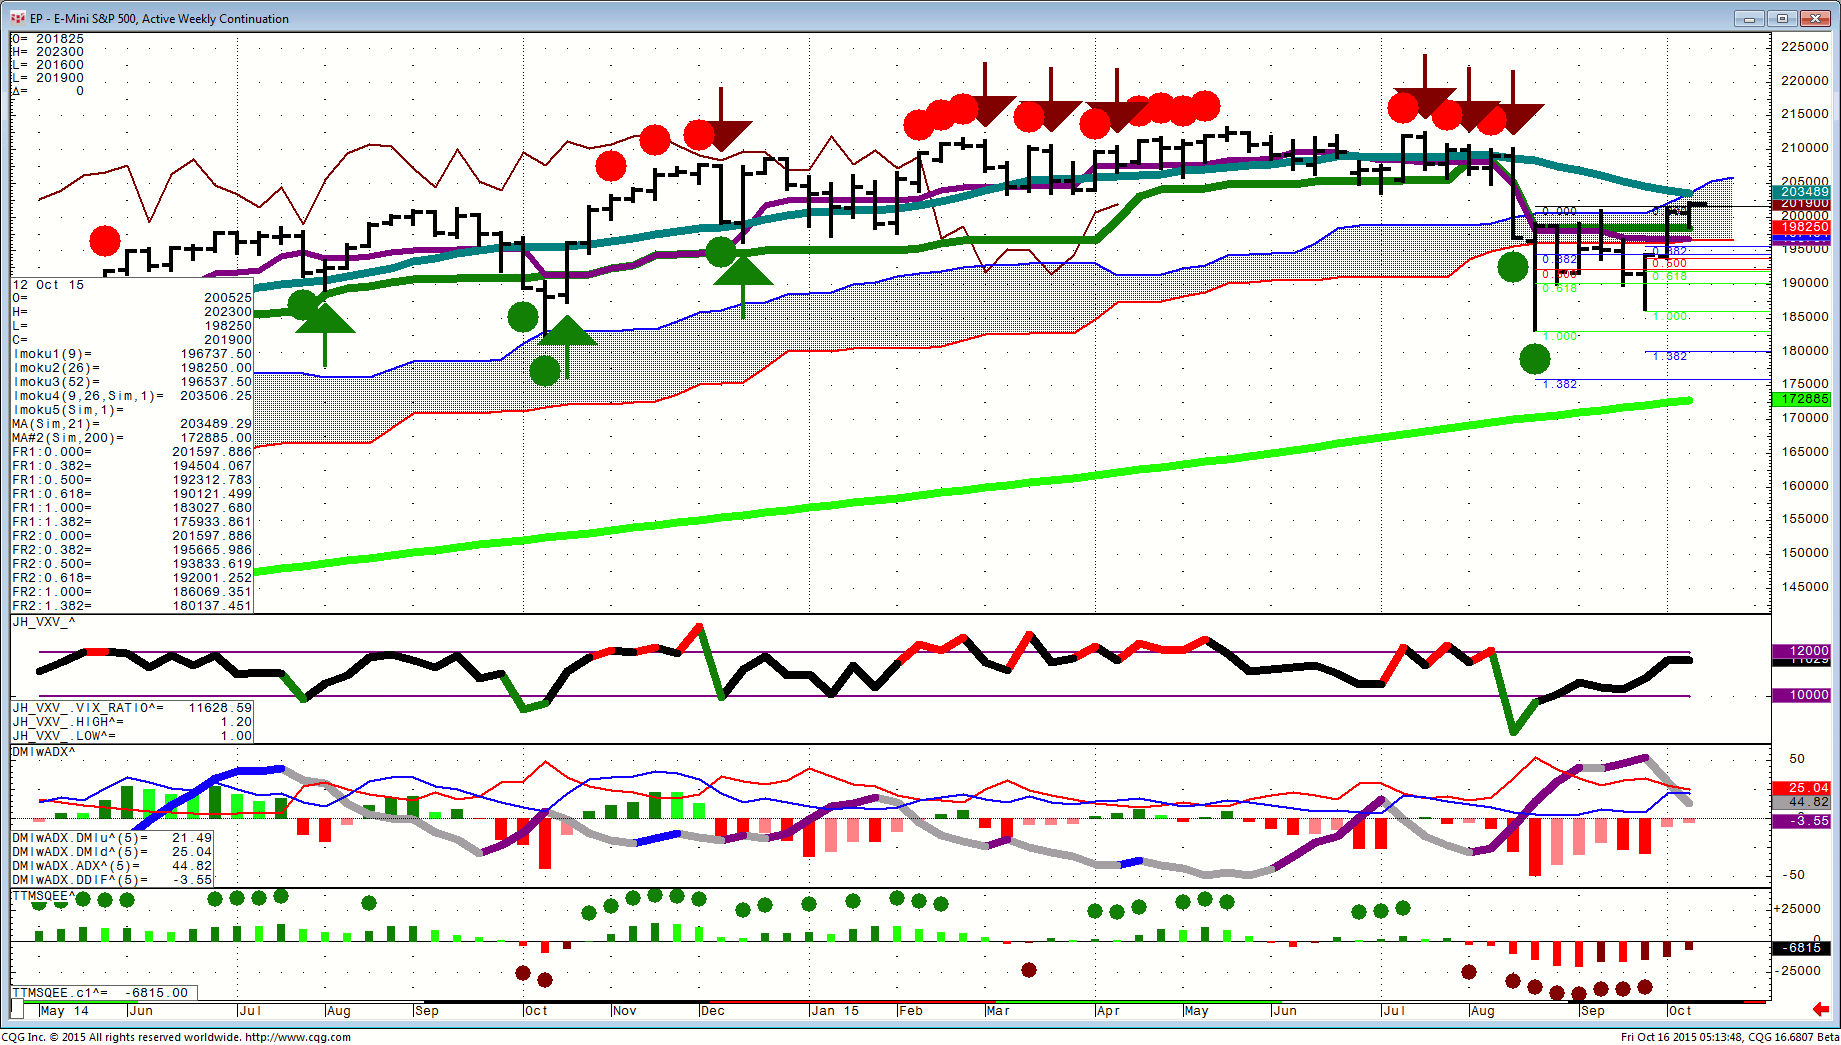
The weekly chart is not flashing red, however the weekly momentum # is 2034 in the Spu’s. A close below 1980 is still needed to confirm a bigger sell off.
The question we have to ask ourselves was yesterday just a major running of the shorts on options expiration?
Given it’s Friday on an up week, I would expect the breaks to hold going into the end of the day.
S&P 500 Daily
S&P 500 weekly
Nasd 100
