We’re approaching the qtrly downtrend line in the spread.
Again this shows Long Equities ( S&P 500 Futures) vs short 30 yr. Treasuries ( 30 yr. Bonds).
This will be the chart of the day and the road map for the next few weeks.
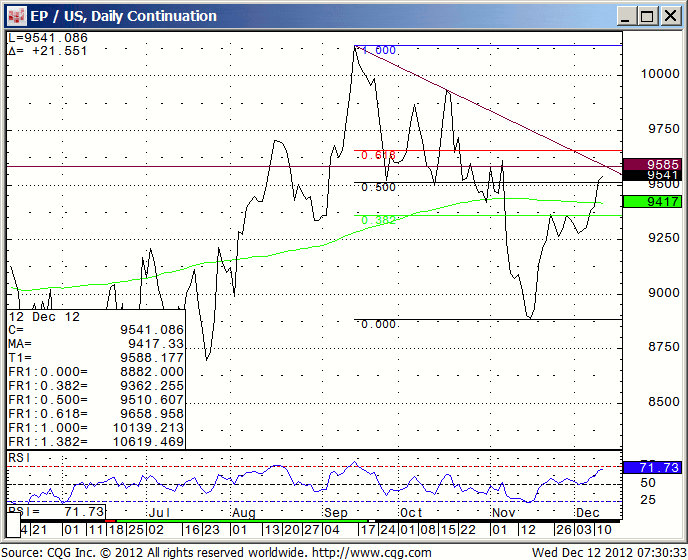


We’re approaching the qtrly downtrend line in the spread.
Again this shows Long Equities ( S&P 500 Futures) vs short 30 yr. Treasuries ( 30 yr. Bonds).
This will be the chart of the day and the road map for the next few weeks.