Stocks...
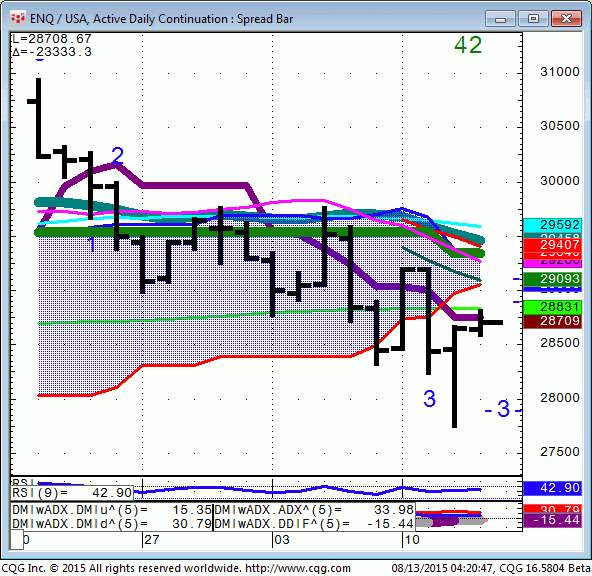
Spu’s & Nasd 100…have filled out their respective point & figure charts.
Nasd 100/30 Yr. Bonds….have rallied back to it’s 200 DMA. This will make upside follow through in the Nasd from here arduous.
SHCOMP…the powers that be seem to be painting the tape, keeping the picture firm above it’s 200 DMA.
Bonds …
FX…
USDCNY...Yuan… I’ve listened to the talking heads bloviate on the Chinese currency.
Some analysts are still sticking with the “it’s appreciating forever line.”
Yuan topped out in the first qtr of 2014. 6.45 is quarterly resistance or Yuan support.
A qtrly close through this level is needed for a move to 6.90.
Yes, it can back and fill from here. 6.45 is your risk.
Commodities…
Metals...looking at the clouds in the GOLD,Silver and related etf’s make me think all we’ve seen is a trading rally.
While the longer term Point & Figure charts have turned up showing 1080 as the risk to be long, at the very least you can’t buy strength.
General Comments or Valuable Insight
……………………………………………………………
Current Positions…. Entry Stop TGT
……………………………………………………………………………….
Working Orders…