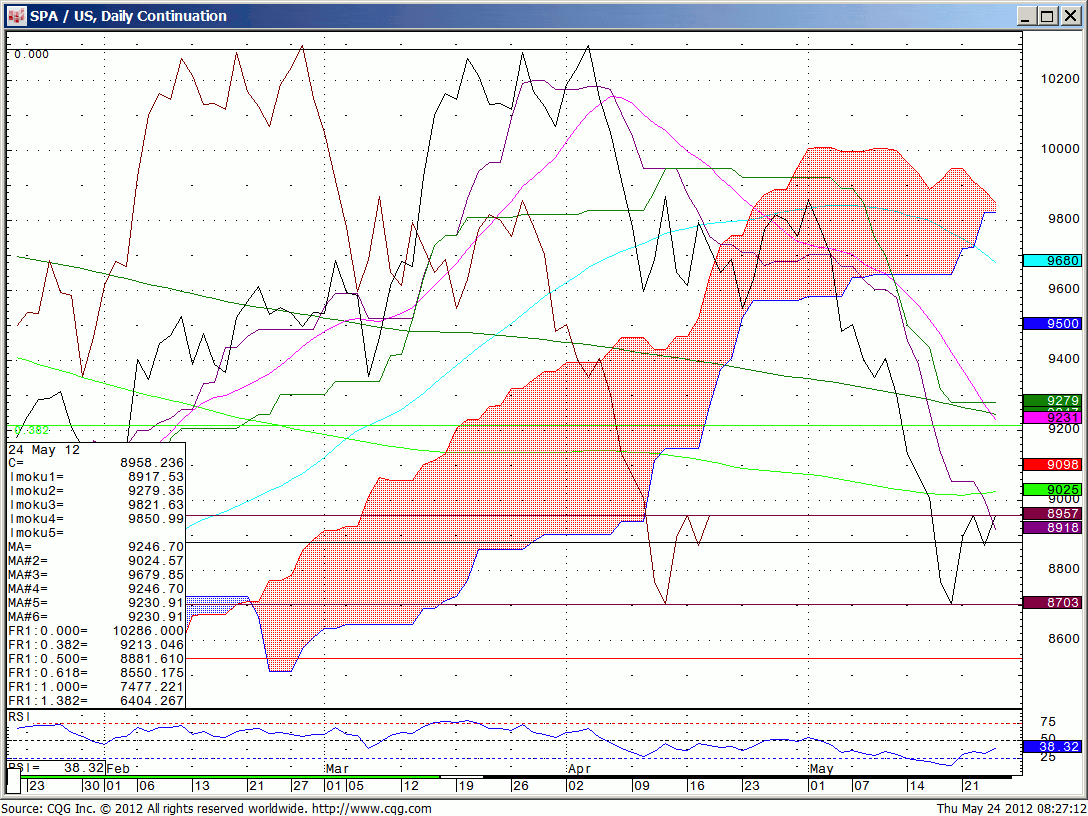
Price action through this recent high in the spread of 89.60 will lead to another assault on the 200 day moving average of 9025.
Once convincingly through, you have room for another couple of figures in the spread.. This is a Long Spu/Short 30 yr. bond futures chart.
We’re at some resistance on a very short term look. Let it play out.