Stocks...
Nikkei…14,780 is 200 DMA resistance.
Bonds
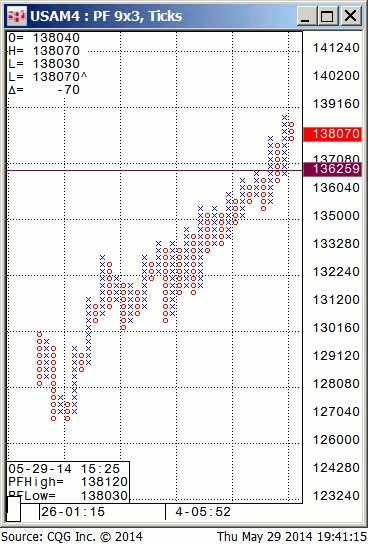
30 yr. Bonds…I’m looking for a 139.28 print after which it will be no longer profitable from a risk/reward point of view to “buy before you sell”
140.15 is the target for this swing.
137.15-20 is support and the low risk buy zone the first time down.
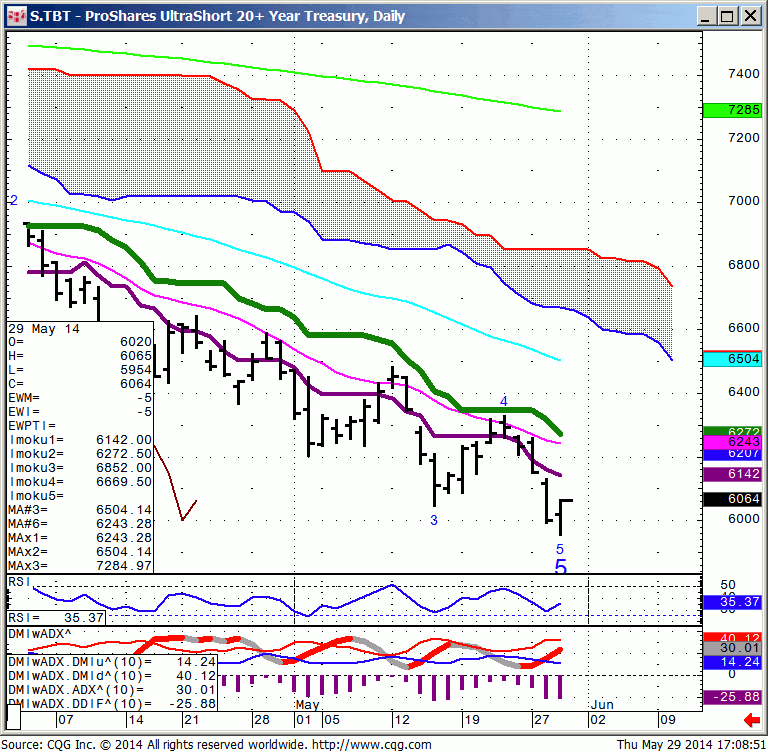
TBT…I will need a close over 61.55 to bottom fish in this ETF.
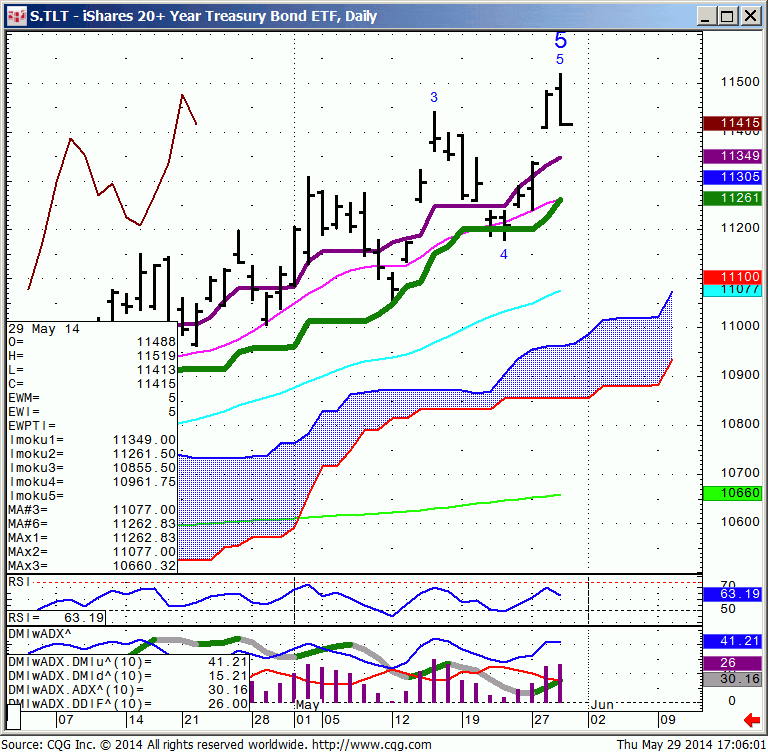
TLT…113.49 is first support. 112.60 is 2nd support and the downside closing pivot.
FX…
EUR/JPY…is getting oversold on the daily time frame. 138.36 is the 200 DMA which will act as a pivot. Good above negative below.
Price action and a close over 138.70 resistance is needed to confirm a change in direction.
AUD/USD… 92.70 is support. A close over 93.10 is needed for upside momentum.
93.60 is Point & Figure resistance. Futures presently trade @ a 10 point discount to cash.
NZD/USD…85.14 is the monthly ORL #. This will ramifications for it’s Antipodean friend, AUD/NZD, which has plenty of room to rally.
Commodities…
Gold…it will take price action and a close over 1260 to run out weak shorts. Anything prints in the low 1220’s should be a first partial profit cover zone for shorts.
JJG…46.70 is the 200 DMA and a low risk buy level.
General Comments or Valuable Insight
Being Month end it will be a very late day game to see where instruments get marked on the close.
We’ve highlighted the 30 Yr. charts with the ETF’s to show where the Bonds can get hung up.
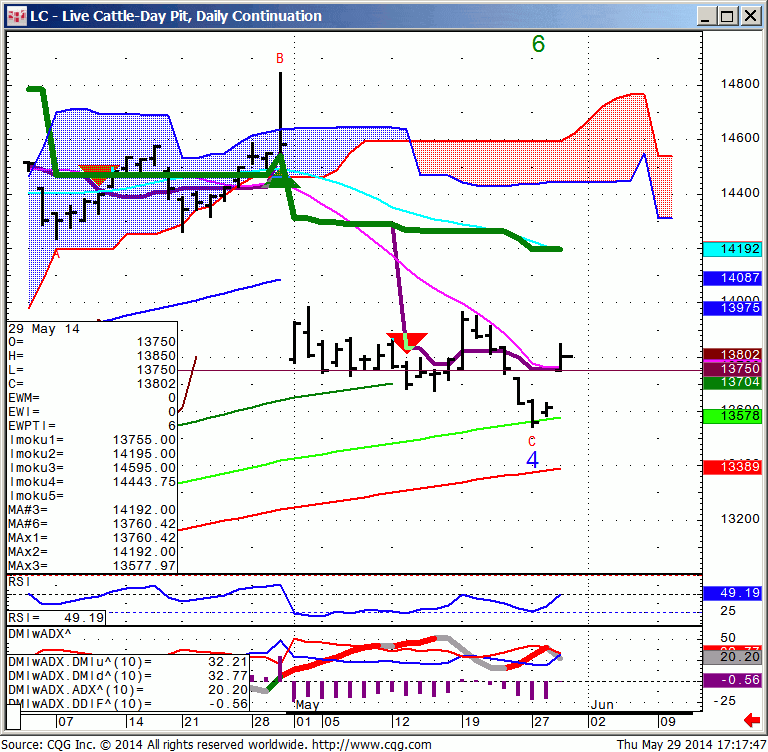
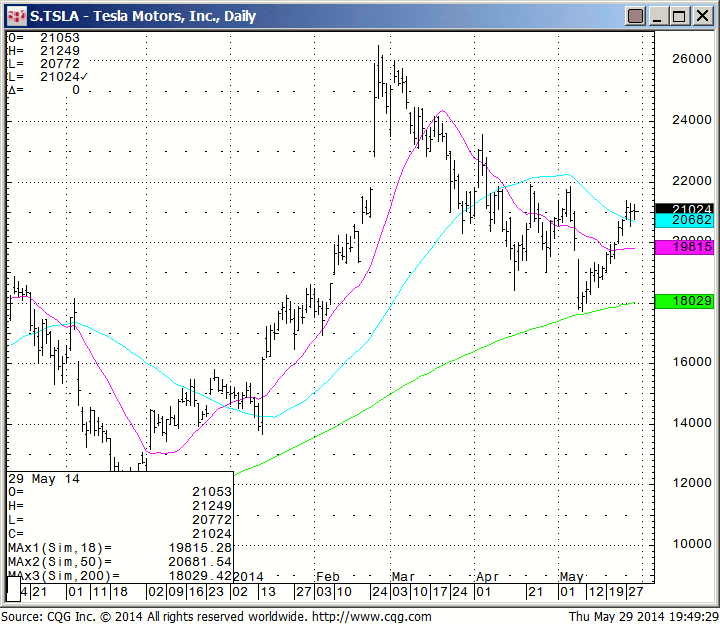
We also threw in a Cattle & TSLA chart to show you the value of trading from the right side of the market @ a 200 DMA.
Cattle traded it, stalled and reversed. This is very typical of price action the first time into the 200 DMA for any instrument.
These setups are very low risk high probability bounce levels, always worth doing.
When you’re approaching one of these 200 DMA’s the market always either looks it’s worst or it’s best.
You don’t always know just how much of a bounce you’ll get going in,
however you can manage your risk around the level to see what you can get.
Most often an instrument takes a day or two to reject the level and reverse direction.
Opening Range Time Frame Trading again today.
Short Term View…
Keep trading to make money. The opportunity will be in individual names.
Individual stocks look to be an easier read based off their own technical s.