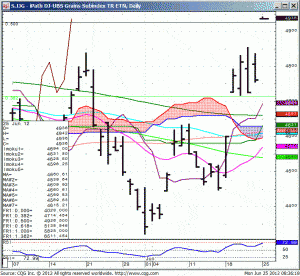
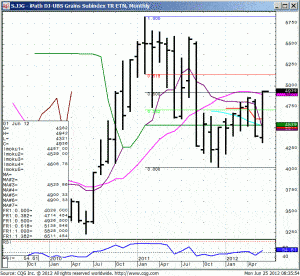
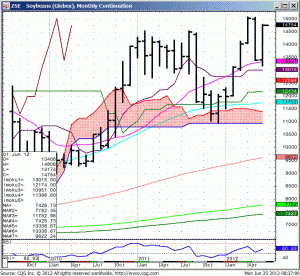
In recent publications we’ve advocated a bullish stance.
Please see our article at Seeking Alphs: Utilizing the JJG to Catch the Next Bull Run in Grains
50.50 seems to be a big zone in the JJG the first time up.
We’ve sent three charts which show a bullish picture for the Grains, however further inspection will show why we think it imprudent to chase ( Buy) this rally without seeing a pullback first.
15 dollars is a very large hurdle in the Soybeans.


